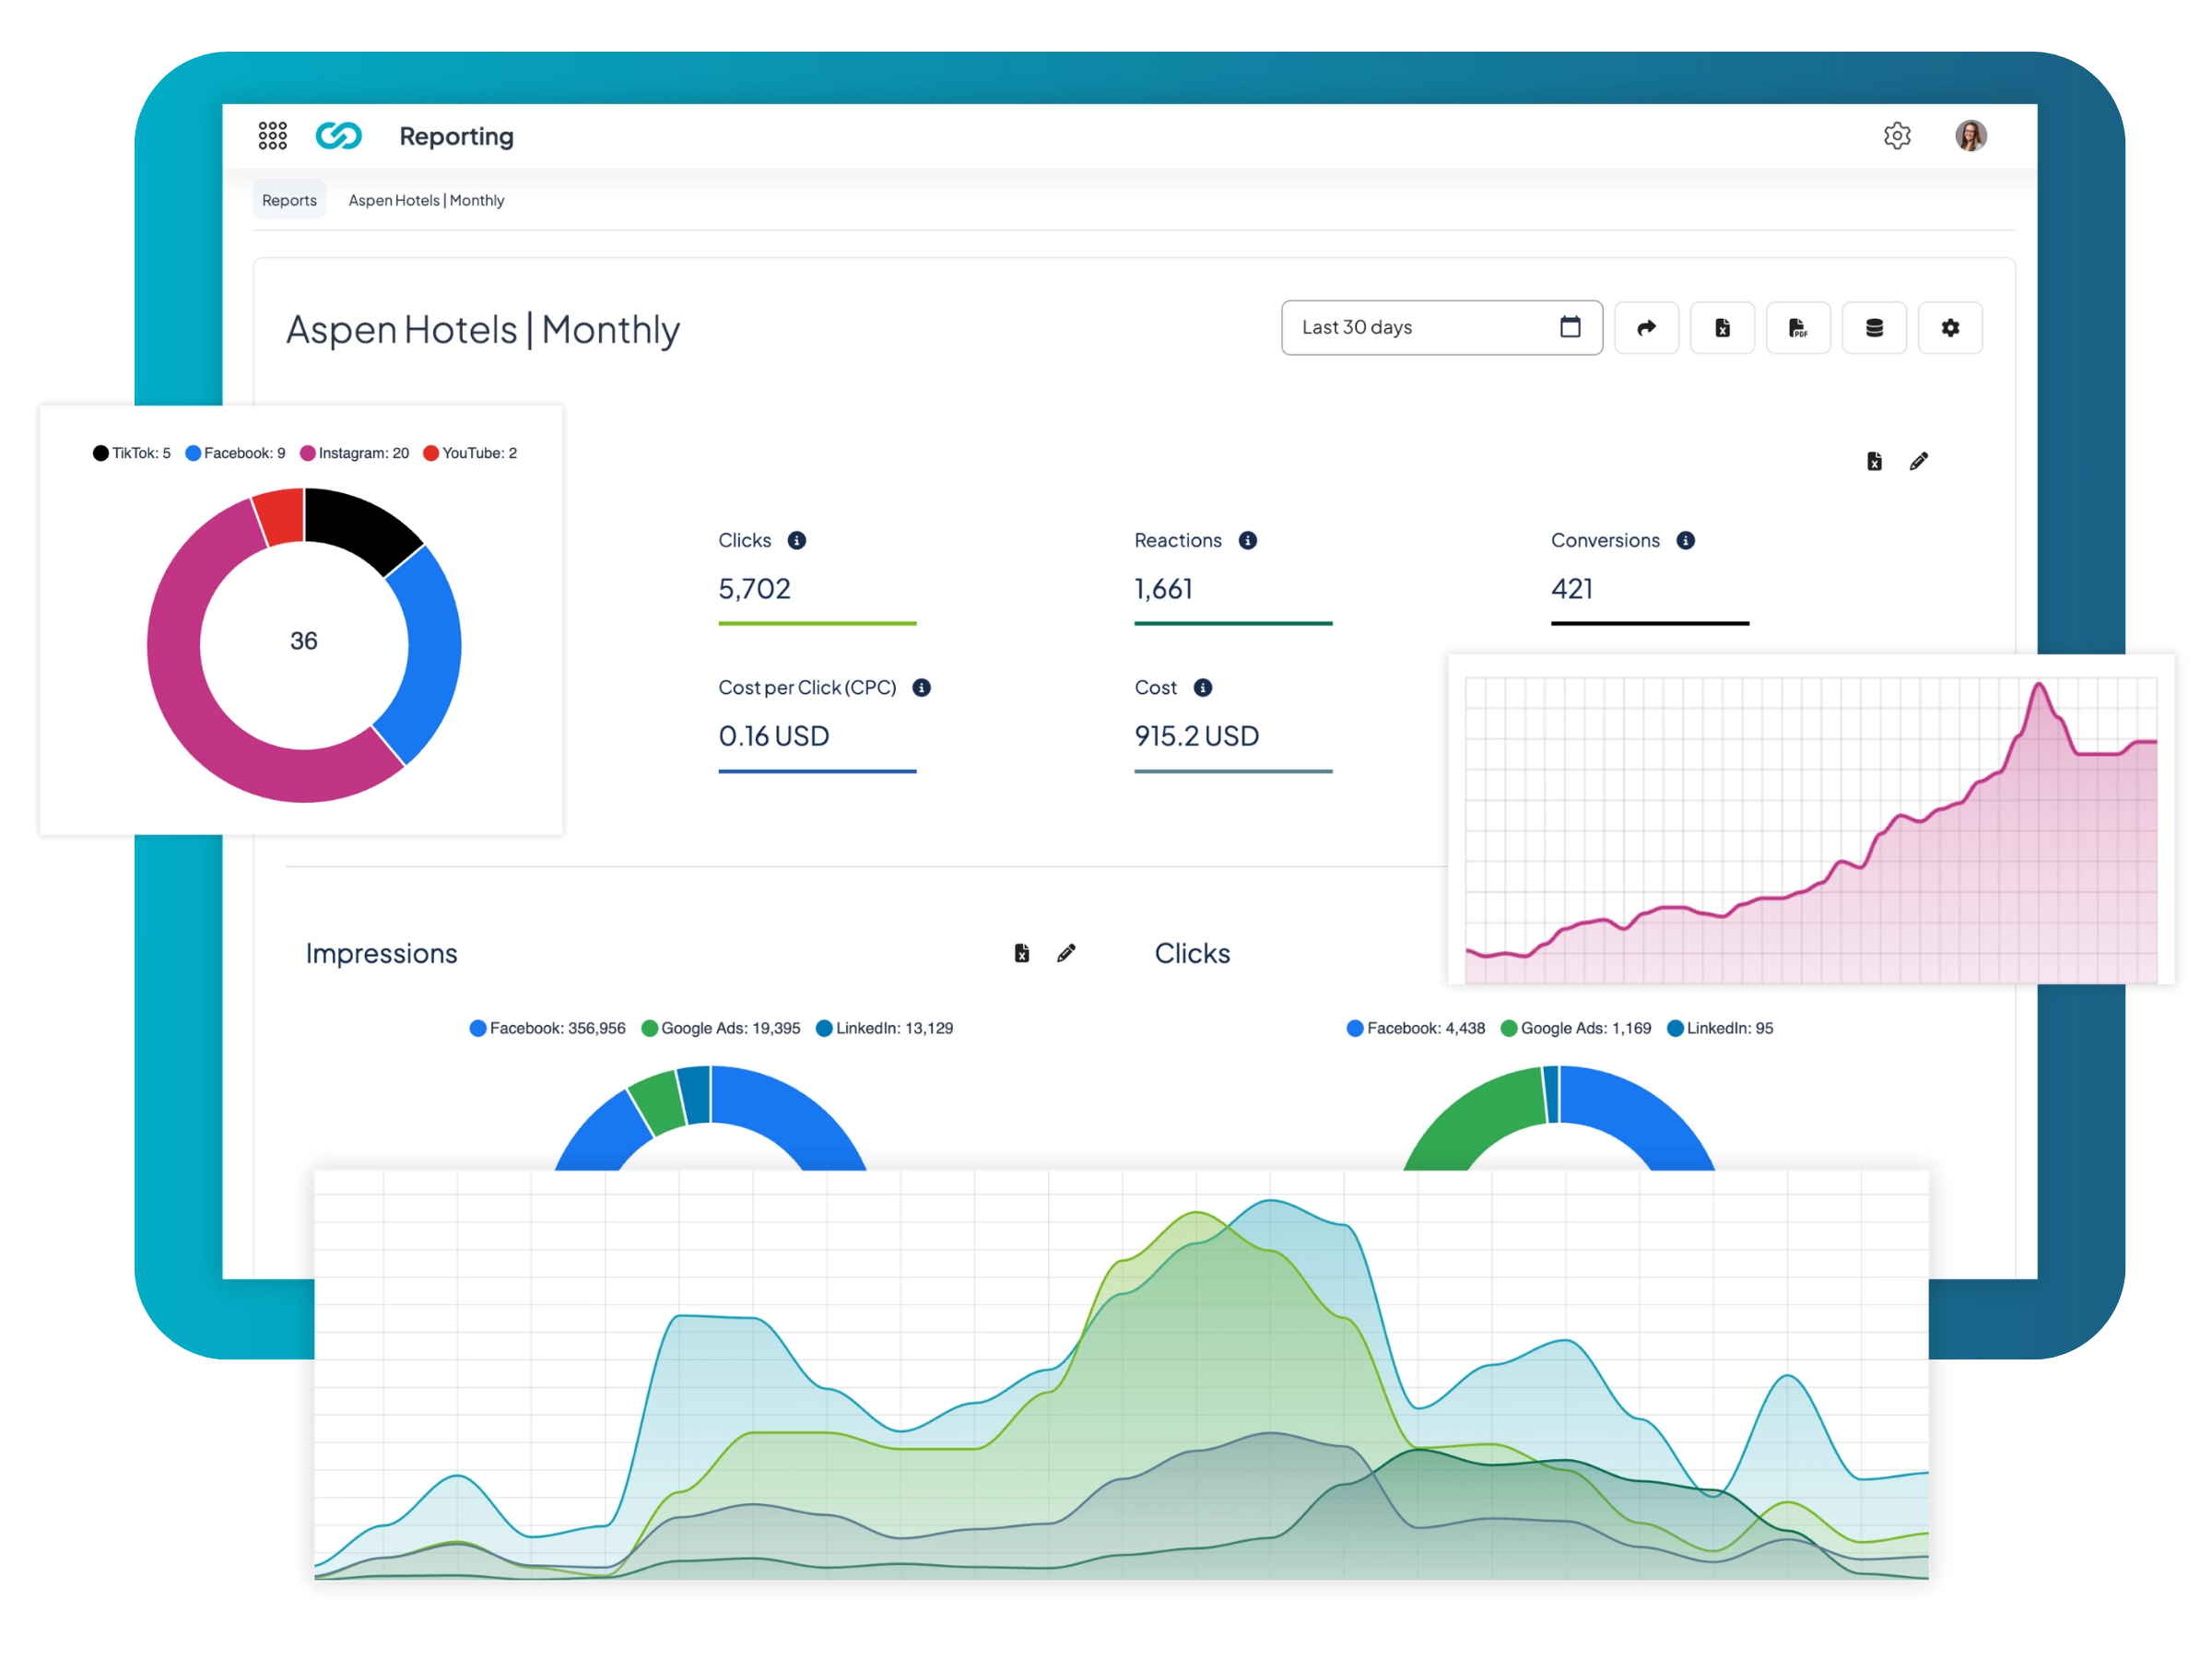
Create individual reports for your KPIs in no time
How well does your Google Ads campaign compare to the Facebook Ads campaign? Or what about the campaign performance of your company's branches or departments?
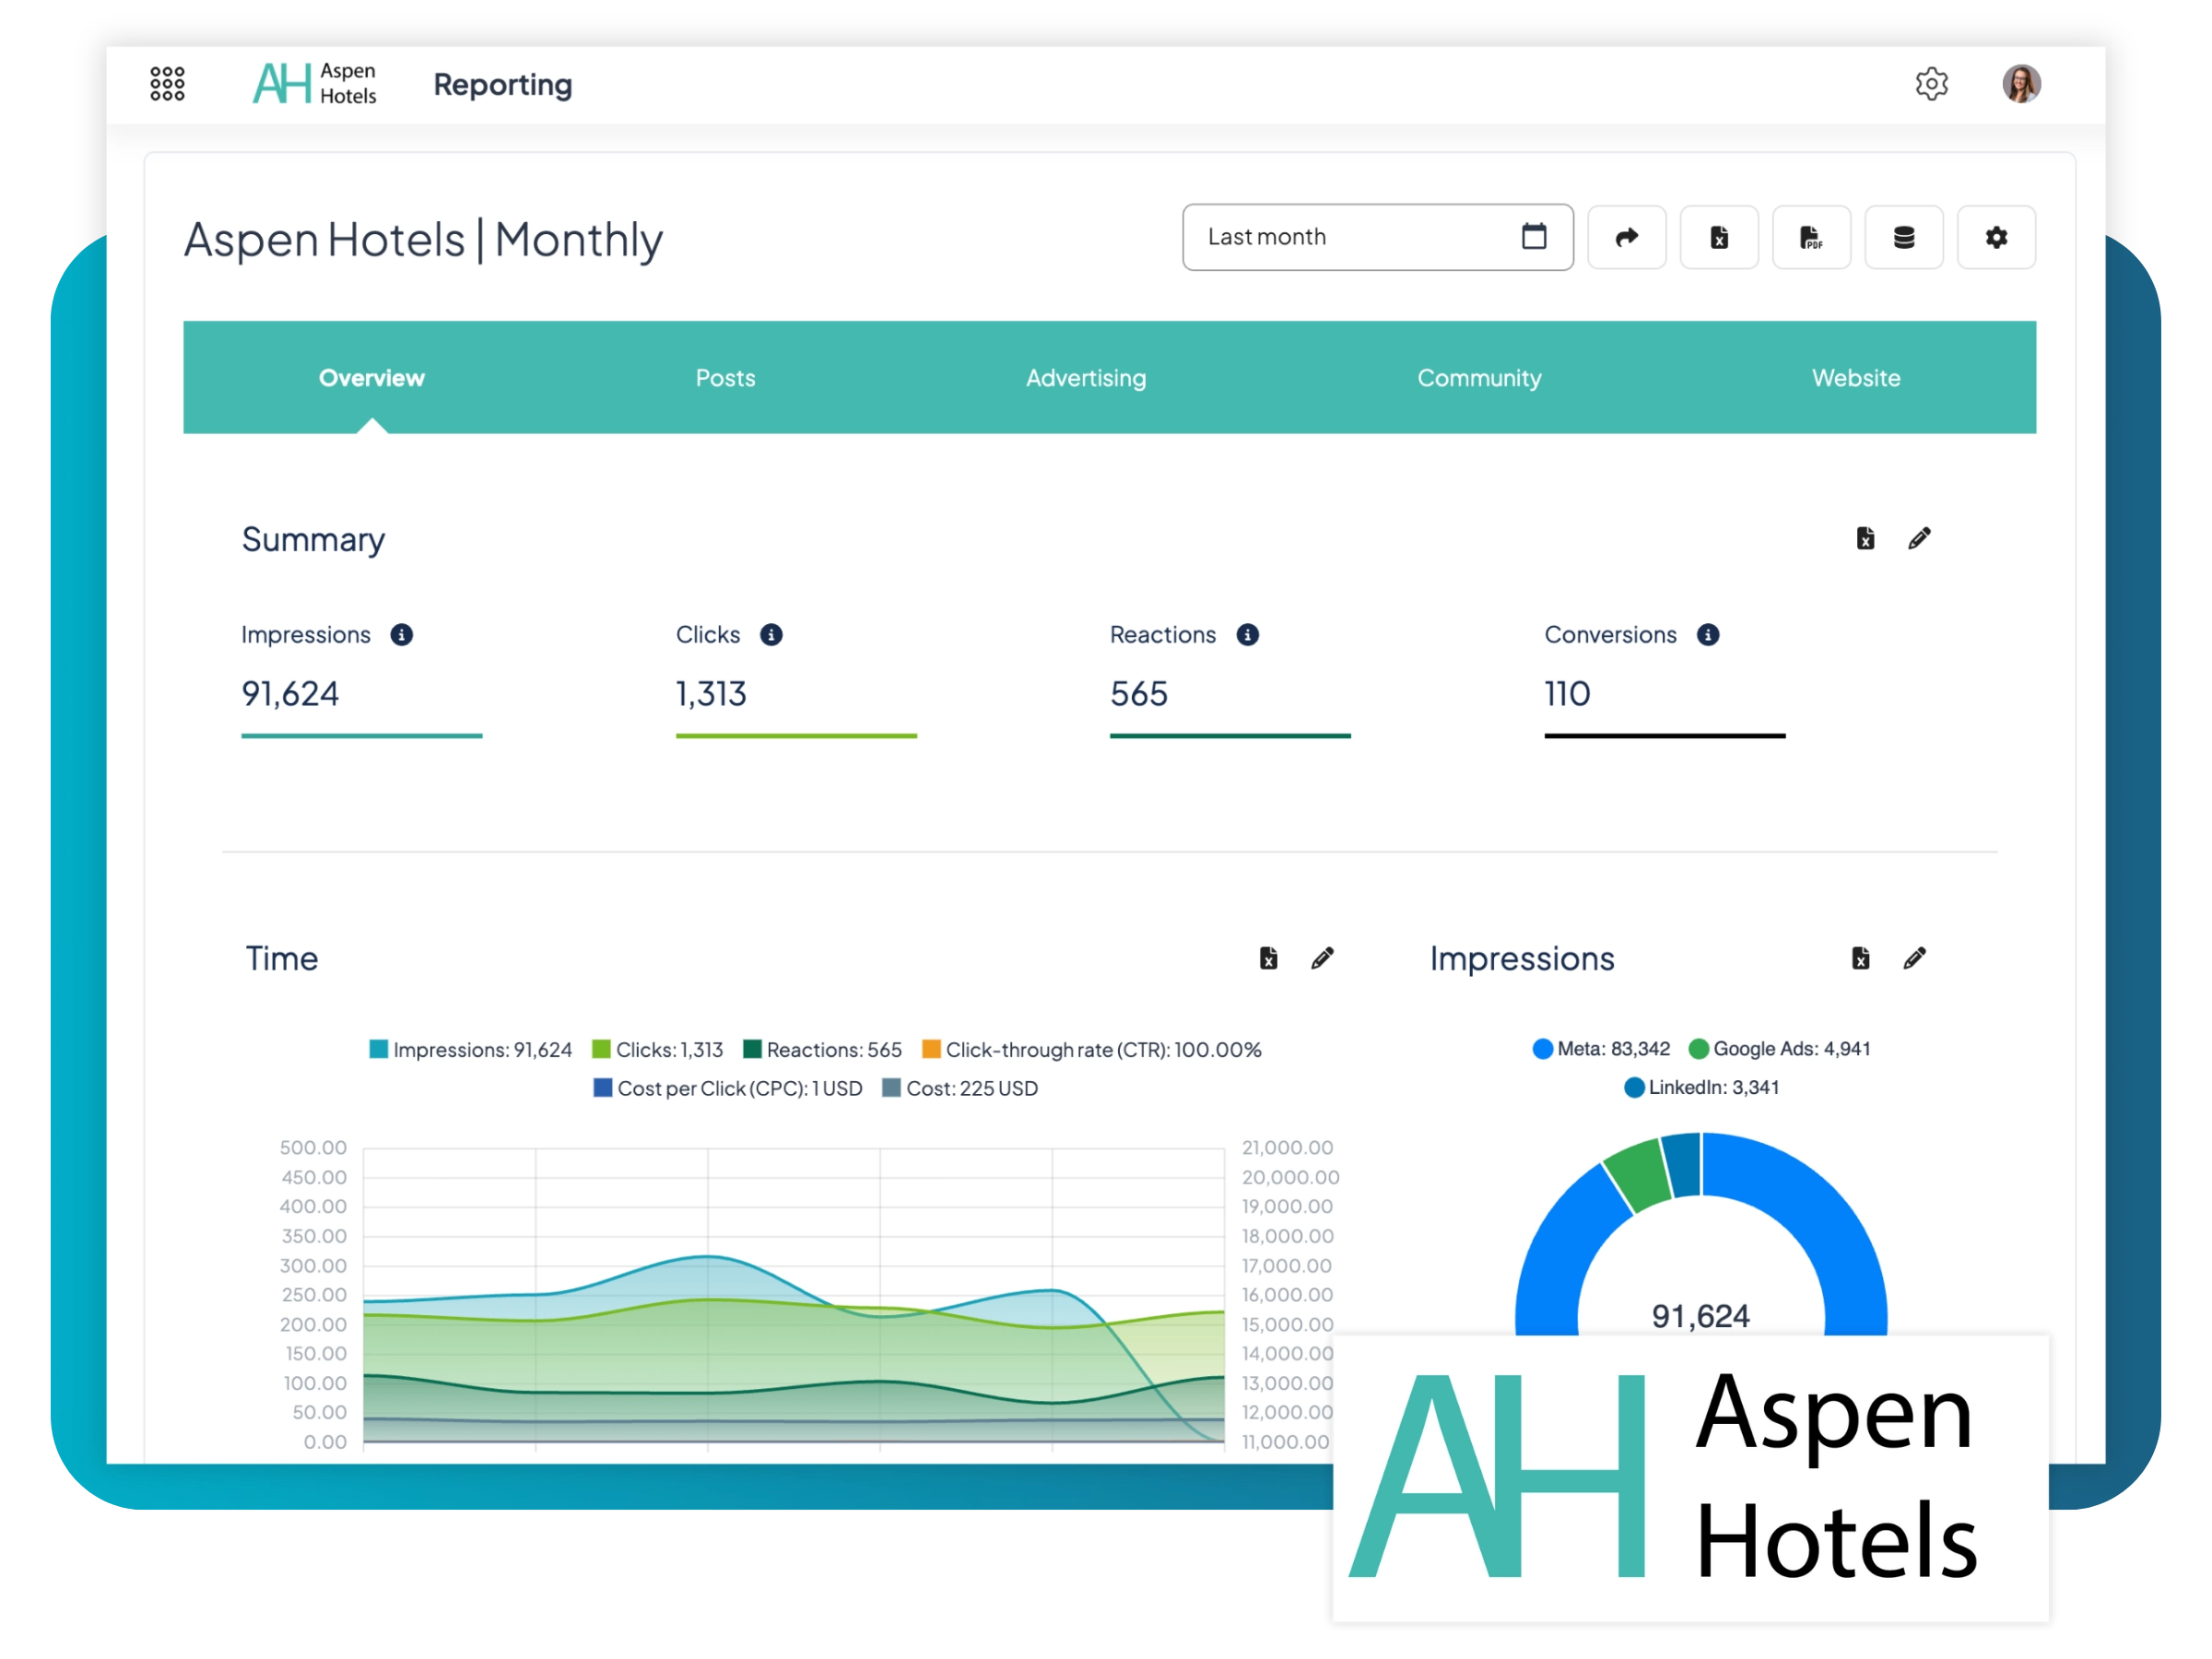
Create comprehensive and individual reports for your activities on Google & Social Media with Adhook.
At the touch of a button, your desired metrics from the following data sources can be visualized in the report:
- Posts data
- Campaign data
- Social Media Page views and follower information
- Website Analytics data
- External data sources (via Google Sheets)
- Data from manually created events (e.g. print activities)

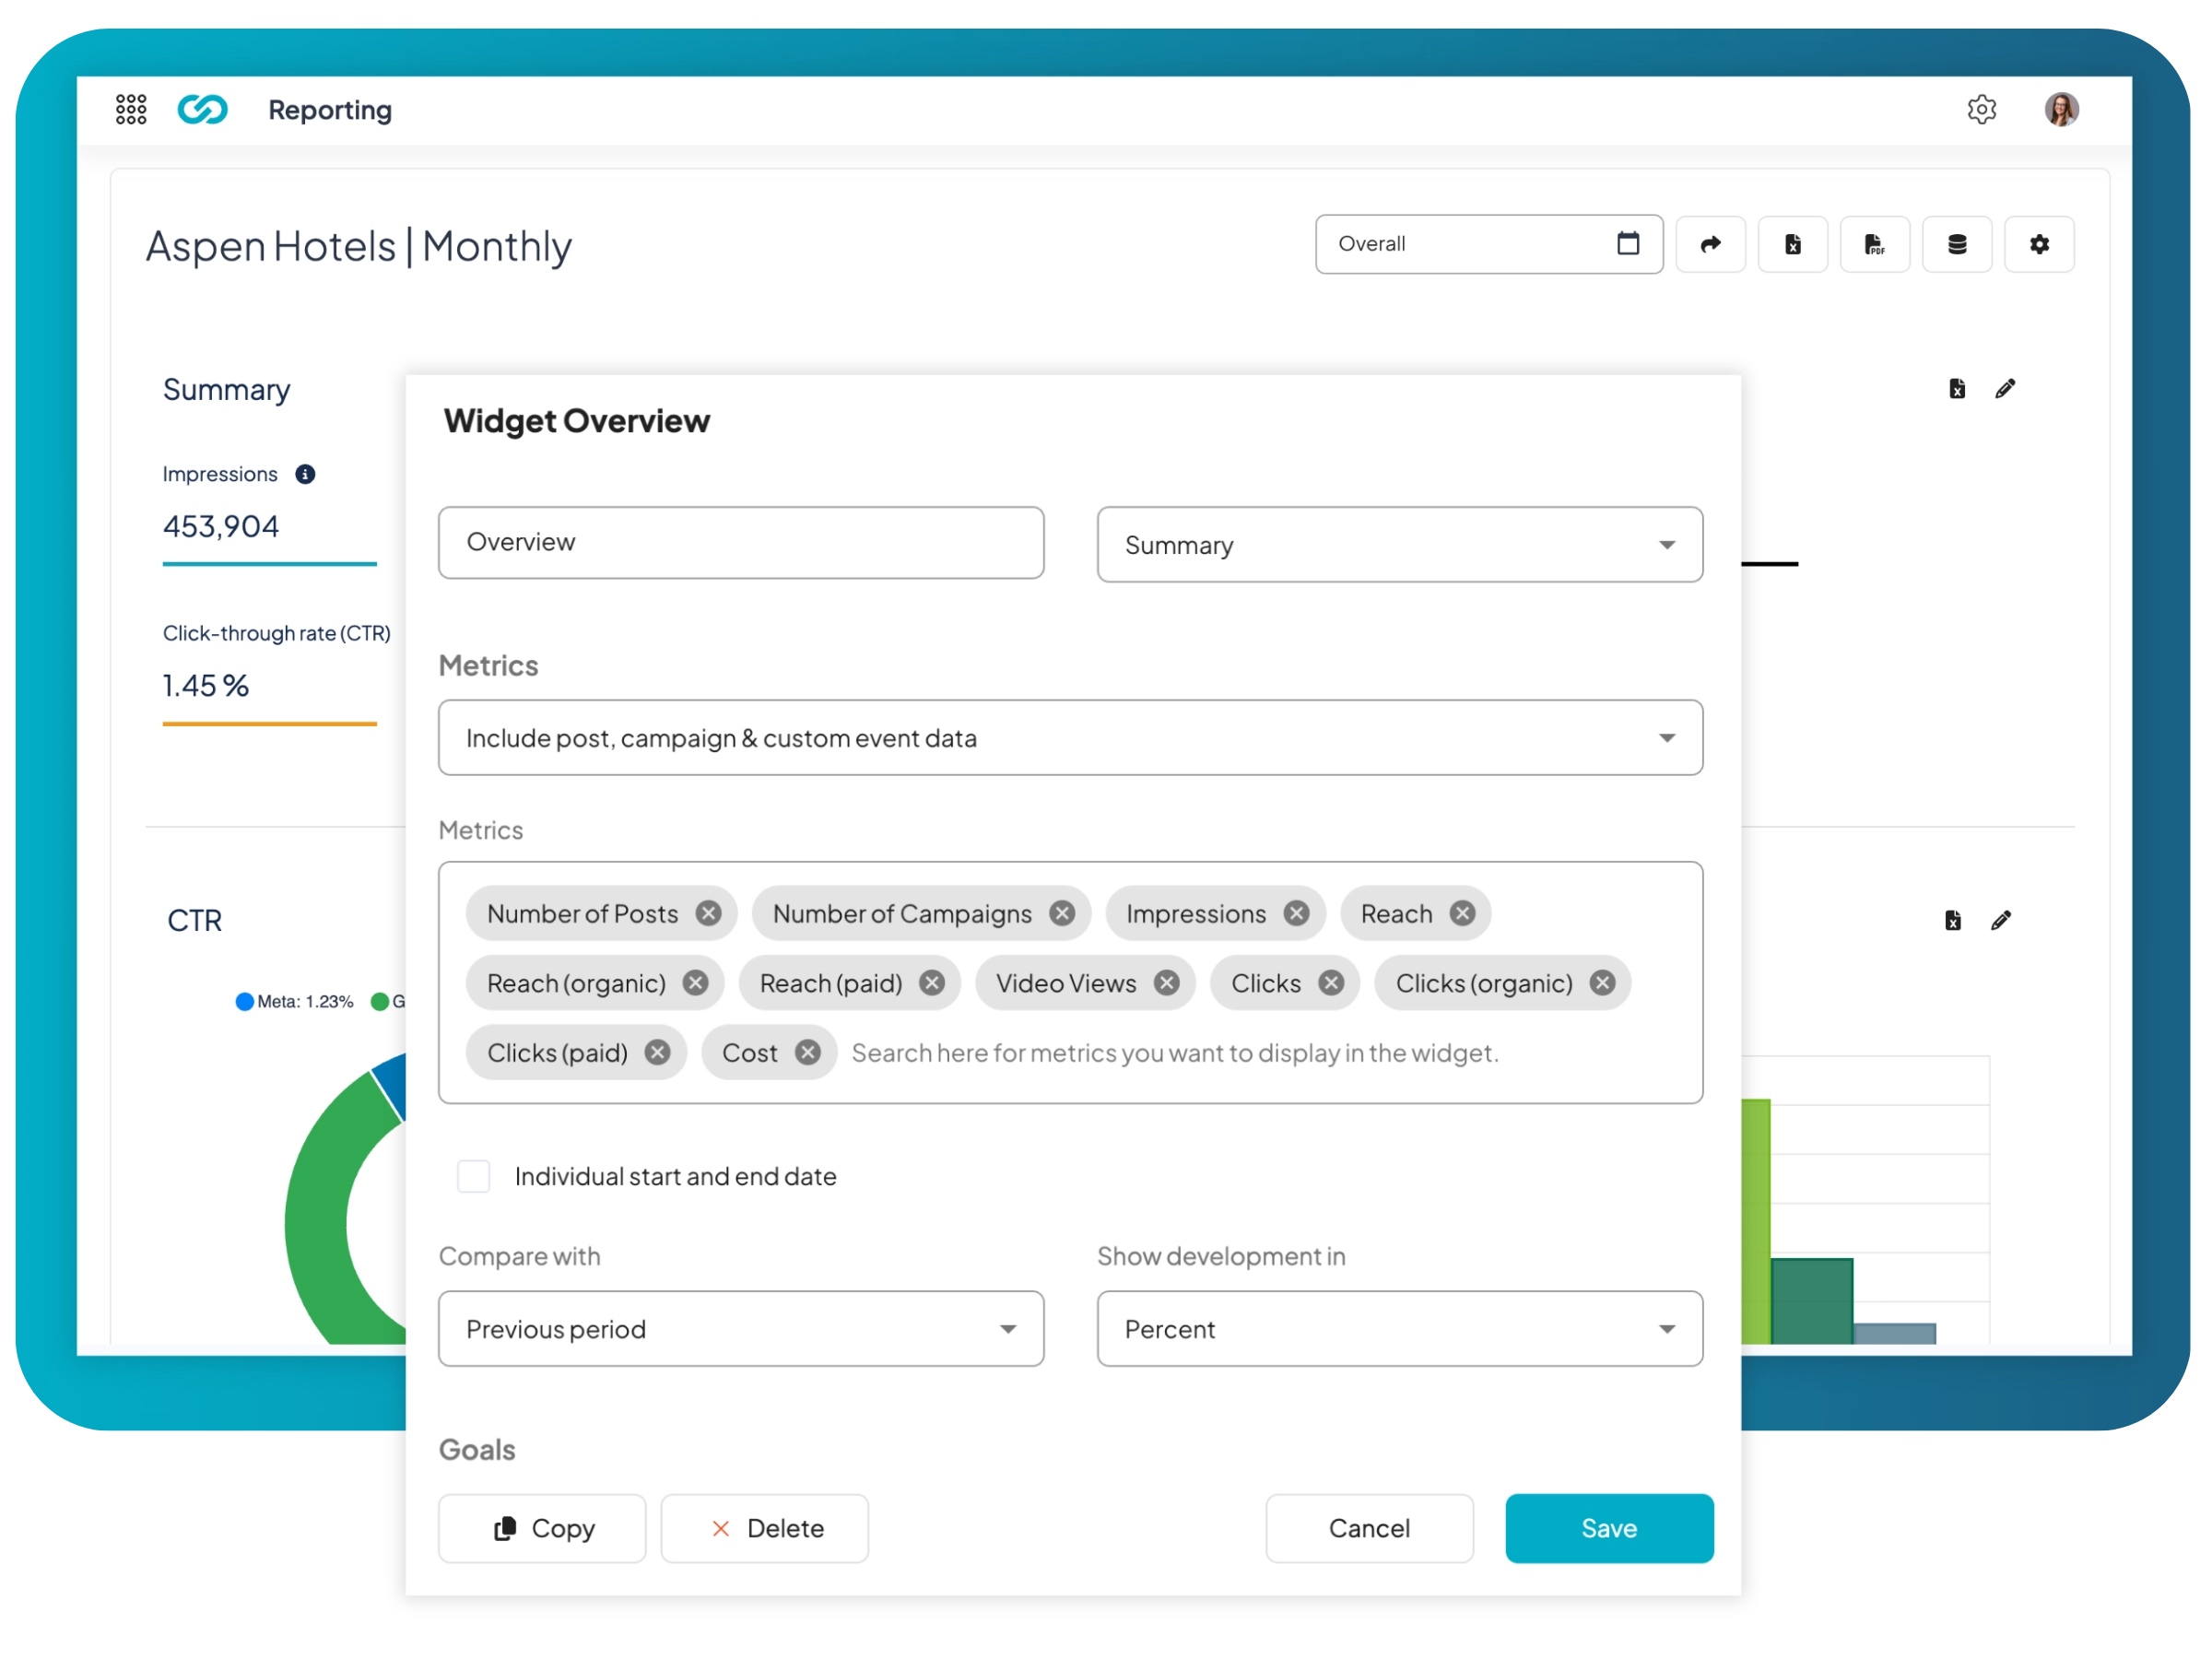
Visualize relevant metrics individually
Choose relevant metrics that you can visualize in different widgets, grouped and sorted individually. The following widgets are at your disposal:
- Summary Tiles
- Pie Chart
- Bar Chart
- Line Chart
- Table
- Title / Subtitle
- Text
- Image
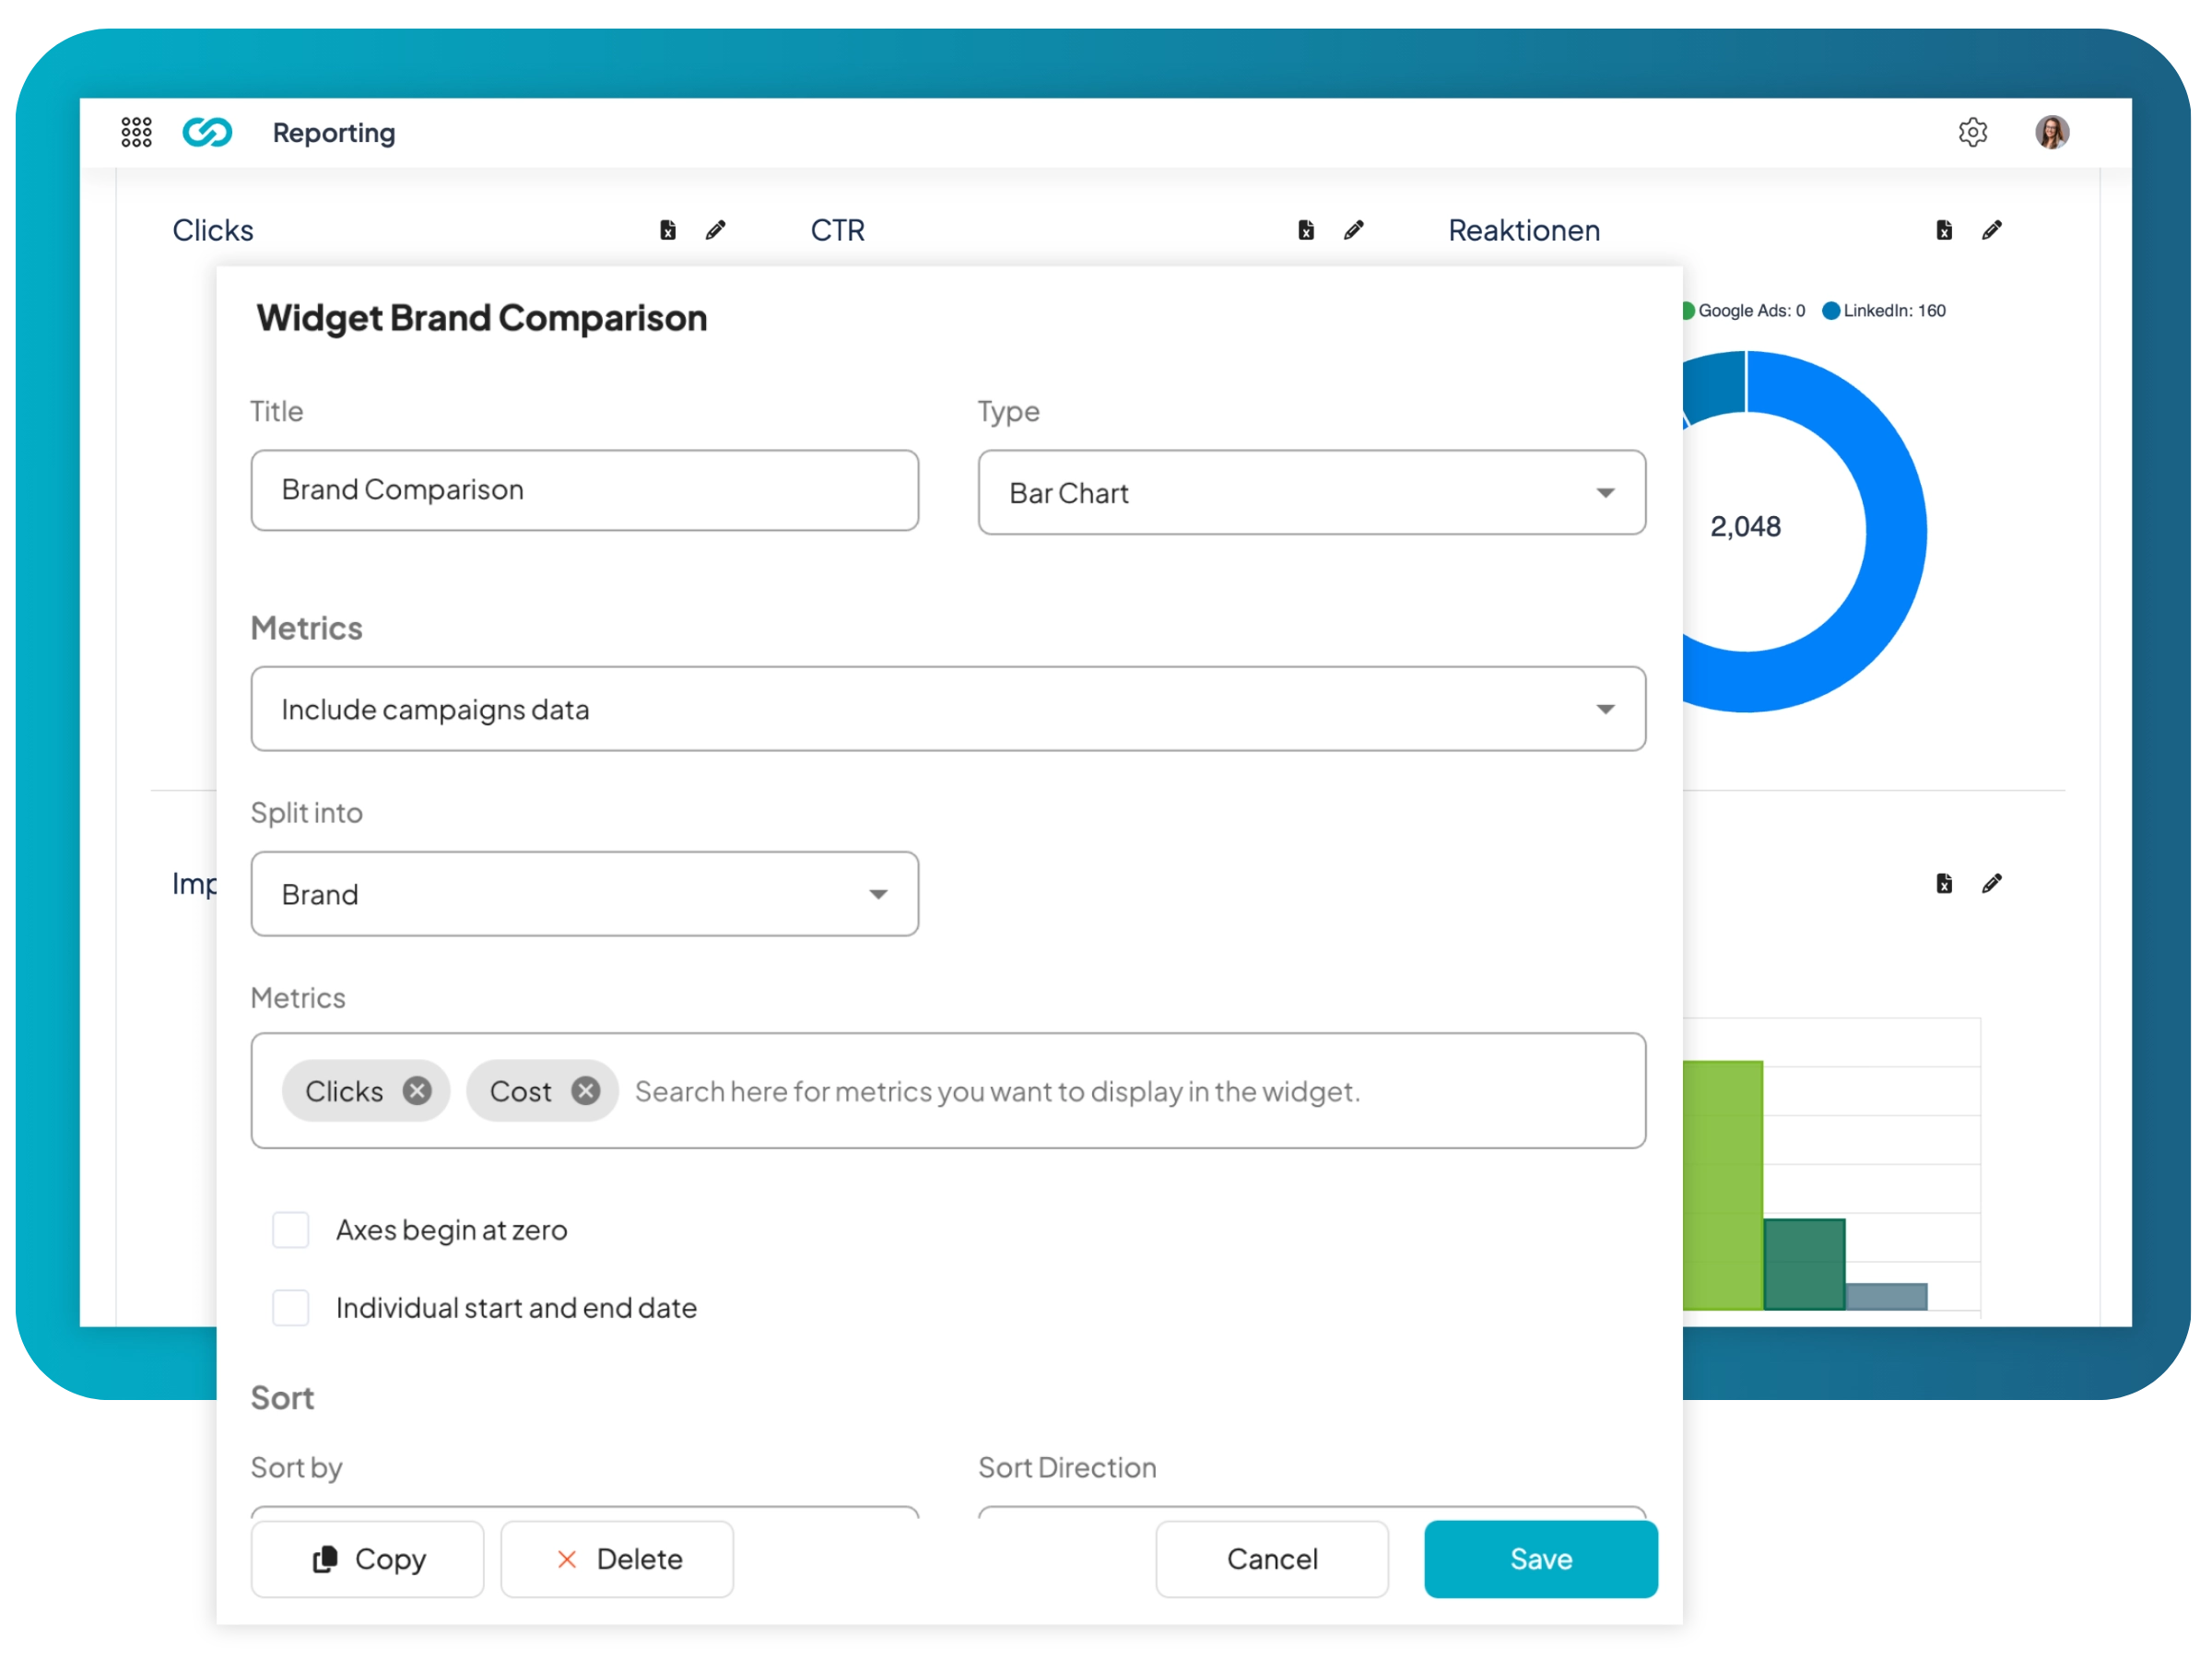
Custom Report Widget Data Breakdown
For tables, pie charts or bar charts, you have various options for splitting the data. The following breakdowns are possible:
- Platforms
- Placements
- Brands
- Posts
- Campaigns
- Ads
- Ad groups
- Keywords (Google Ads)
- Conversions
- Conversion categories
- Job Functions (LinkedIn)
- Job Titles (LinkedIn)
- Industries (LinkedIn)
- Organizations (LinkedIn)
- Countries
- Regions
- Cities
- Age Ranges
- Gender
- Website Traffic Sources
- Website Traffic Landing Pages
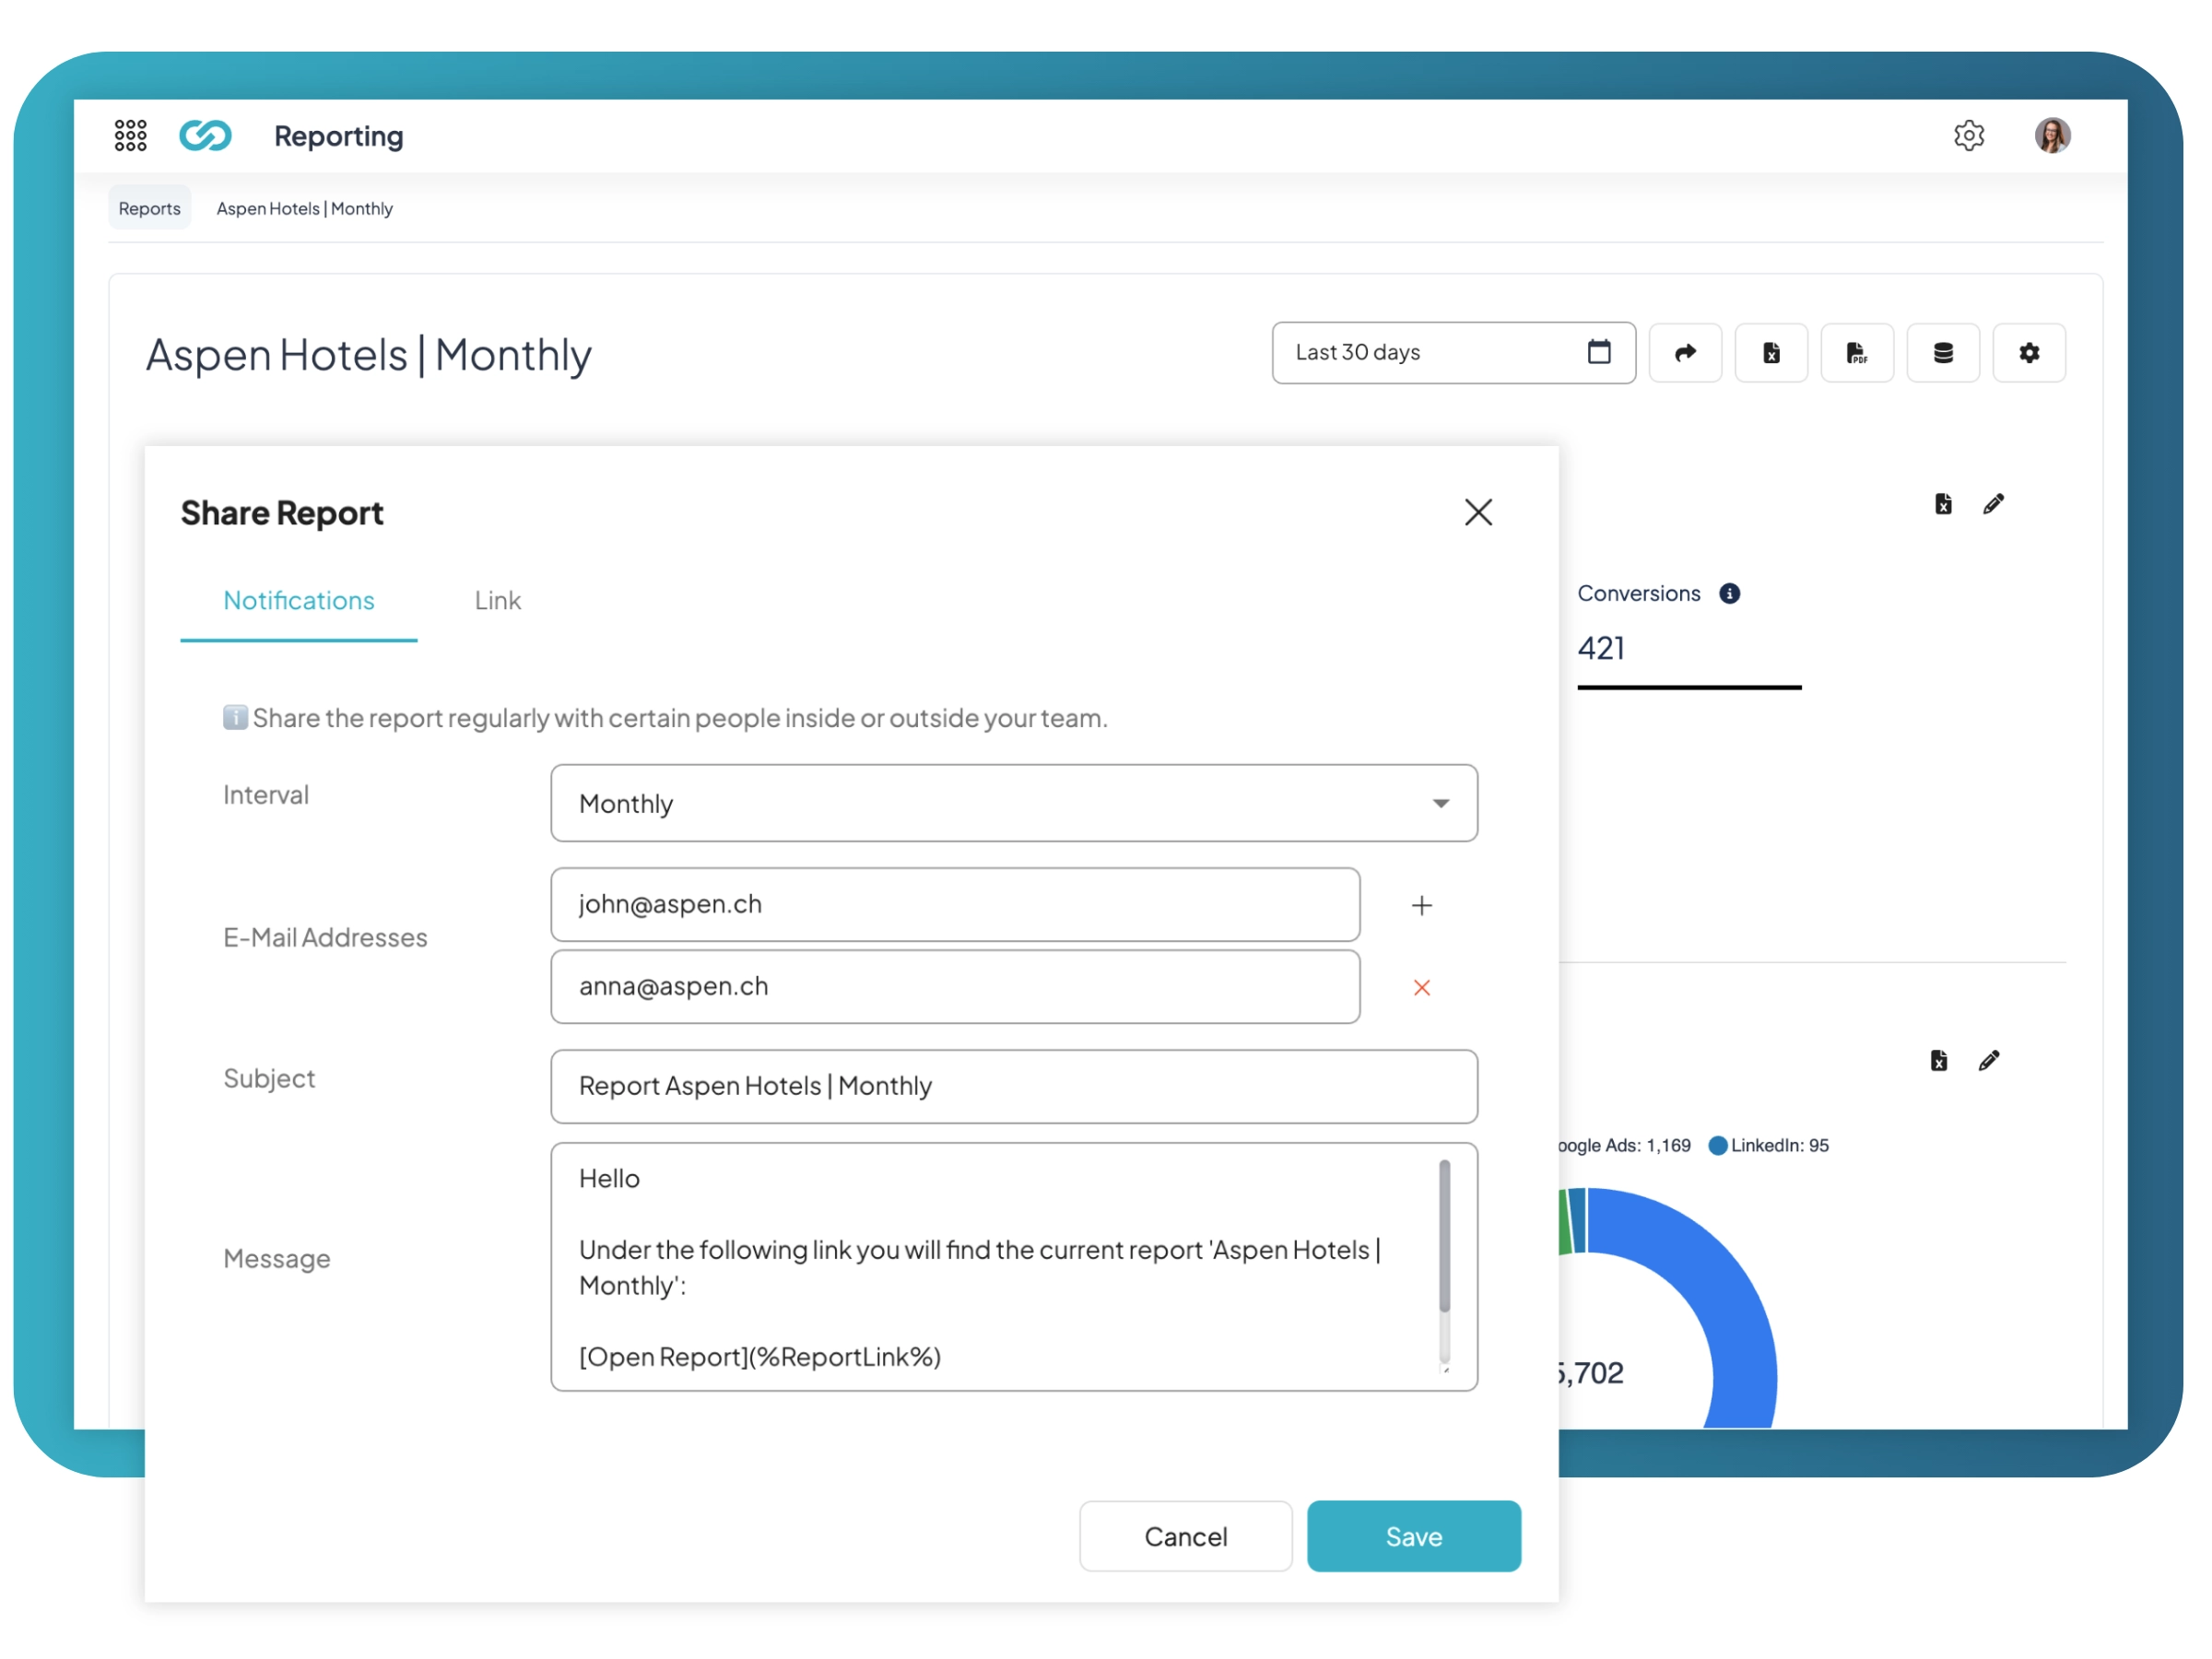
Automatic Report Sharing
Have your report prepared regularly by Adhook and sent via e-mail to all
involved persons. Your report can also be viewed by people without Adhook login and exported
as PDF or Excel.
A report can be shared weekly, monthly or via a share link.
Use Report Templates
The Adhook report templates allow you to create a report for your team, areas, departments or branches in a few seconds and customize it to your needs.
White Label Reports
Use the white label options of Adhook to prepare the reports in your corporate design and share them with your customers, offices or partners.